I am a huge fan of the Elastic stack as it can provide a great deal of visibility into even the largest of environments, which can help enable both engineering and security teams rapidly triage technical issues or incidents at scale. There’s also the fact that unlike Splunk, the Elastic software is free to use and has no limits.
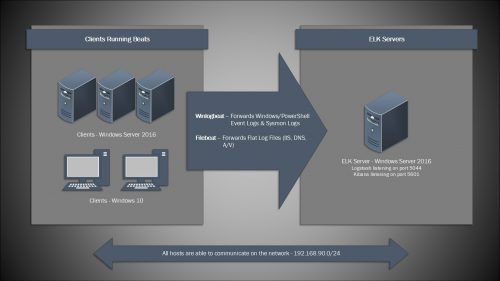
With ELK, the server will run a combination of services including Elasticsearch, Logstash, and Kibana. Logstash will be responsible for listening on the network and receiving the logs from remote hosts, it then forwards those logs to Elasticsearch to be indexed and stored. Finally, Kibana serves as the web based front end which includes search, dashboards, reporting and much more.
On the remote hosts, a software agent is used to forward the local logs to the ELK instance. Winlogbeat is the agent that will be deployed in this post, and it will be used to grab various event logs. Filebeat is another type of agent and it can be used to pick up flat log files (IIS, FTP, DNS, etc).
Now, I will say that I prefer to run the ELK services on Linux for few reasons, one example being it is generally easier to install (via repo) and maintain an instance long term. However, there has been a considerable amount of interest in running these services on Windows OS’s based on my previous post, Installing Elasticsearch, Logstash and Kibana (ELK) on Windows Server 2012 R2, so now I am going to cover installing the newest Elastic packages on Windows Server 2016.
Here is everything I am going to cover in this post:
- Installing and configuring Elasticsearch, Logstash, and Kibana as Windows services
- Installing and configuring Winlogbeat to forward logs from the ELK server into ELK
- Installing and configuring Curator as a scheduled task (optional)
And then in Part II, I will cover:
- Installing and configuring Winlogbeat on Windows 2016 client server
- Installing and configuring Sysmon on Windows 2016 client server
- Configuring Winlogbeat to forward Windows, PowerShell, & Sysmon Events
Installing Java
The first step in this process is getting the server prepared for the Elastic services by installing Java and setting up an environmental variable so Elasticsearch can locate Java.
-
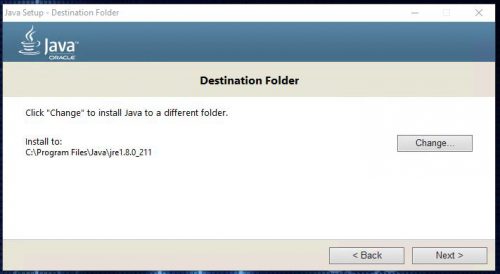
Download and install Java – Make sure to get the x64 version for a 64 bit OS:
https://java.com/en/Take note of the installation path during the install, you’ll need to know that for the next step. It should be something like C:\Program Files\Java\jre1.8_xxx:
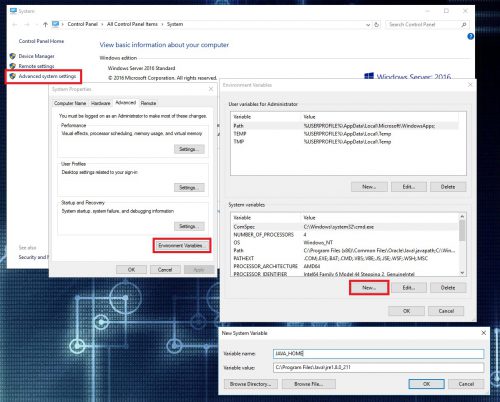
- Create a system variable named JAVA_HOME with a value of the path to the java installation.
- Reboot the server.
Installing Elasticsearch
Elasticsearch is the core of the ELK stack and is where all of the data will be stored. Elastic now has a .msi package available for Elasticsearch which makes it a fairly simple install on Windows.
-
Download the .msi package from Elastic:
https://www.elastic.co/downloads/elasticsearch -
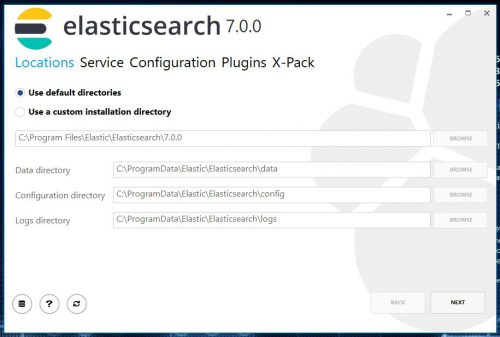
Double click the package to begin the installation, follow the prompts leaving all the defaults.
Note: You can change the data directory location during the install, which is useful if you were planning on using dedicated drive or separate partition.
-
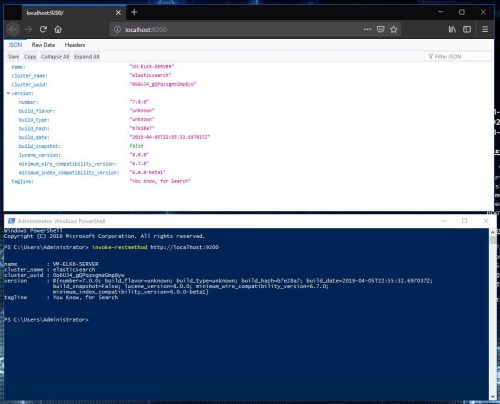
Now to test if Elasticsearch is up and running browse to http://localhost:9200 or make a request to the server with PowerShell using the following command:
PS C:\> invoke-restmethod http://localhost:9200
The Elasticsearch install is now complete.
Installing Logstash
Logstash is responsible for receiving the data from the remote clients and then feeding that data to Elasticsearch. Installing Logstash is a little more involved as we will need to manually create the service for it, but it is still a fairly straight forward install.
-
Download the Logstash package in .zip format:
https://www.elastic.co/downloads/logstash -
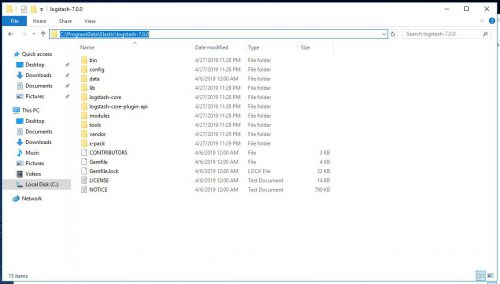
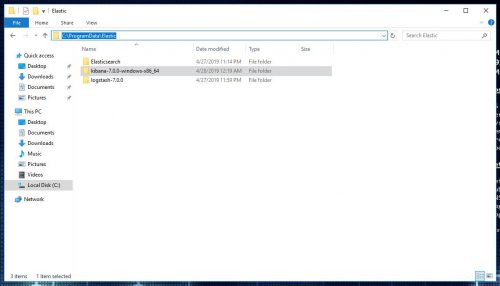
Unzip it to where it is going to be installed to permanently, in this case I am using C:\ProgramData\Elastic\Logstash.
Note: You may run into issues starting the service if the installation path contains a space, ex C:\Program Files\Elastic. To get around this wrap the path in quotes when creating the service in NSSM, ex “C:\Program Files\Elastic”.
-
Next is the configuration file, which needs saved to the Logstash\config directory. You can download a copy of the one I used here:
logstash.conf.zipThere is also a sample configuration file in the config directory named “logstash-sample.conf” that you can refer to.
-
NSSM is going to be used to create the service for Logstash. You can download NSSM (Non-Sucking Service Manager) here:
https://nssm.cc/download -
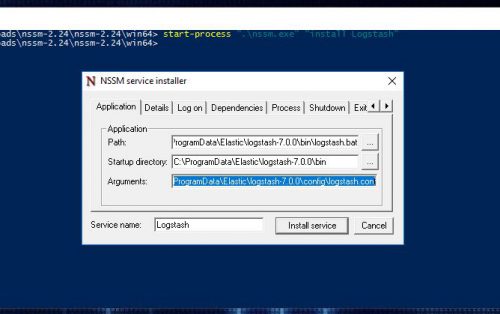
Unzip the NSSM package and then use the following command to create the Logstash service:
PS C:\Users\Administrator\Downloads\nssm-2.24\nssm-2.24\win64> start-process ".\nssm.exe" "install Logstash"
-
Set the following values on the Application tab:
Path: C:\ProgramData\Elastic\logstash-7.0.0\bin\logstash.bat
Arguments: -f C:\ProgramData\Elastic\logstash-7.0.0\config\logstash.conf
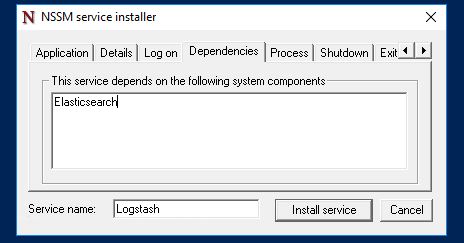
Service name: Logstash - Set a dependency of Elasticsearch:
- Click Install service.
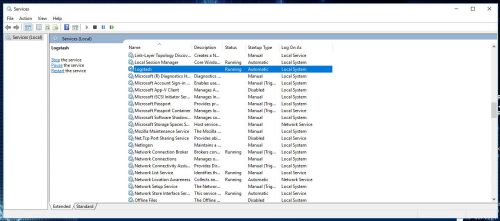
- Open services.msc and verify the service starts:
-
Don’t forget to add a firewall rule to allow the inbound connections:
PS C:\> netsh advfirewall firewall add rule name=Logstash-Inbound-5044 dir=in action=allow protocol=TCP localport=5044
Installing Kibana
Kibana is the web based front end that will be used to search the data stored in Elasticsearch. The Kibana installation is very similar to the Logstash install, and NSSM will be used again for the service creation.
-
Download the Kibana package for Windows in .zip format:
https://www.elastic.co/downloads/kibana -
Unzip it to where it is going to be installed to permanently, in this case I am using C:\ProgramData\Elastic\Kibana.
Note: You may run into issues starting the service if the installation path contains a space, ex C:\Program Files\Elastic. To get around this wrap the path in quotes when creating the service in NSSM, ex “C:\Program Files\Elastic”.
-
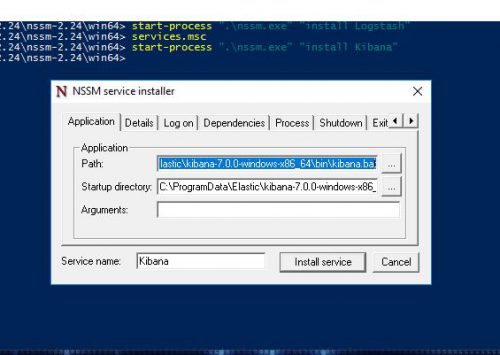
Use the following command to call NSSM and create the Kibana service:
PS C:\Users\Administrator\Downloads\nssm-2.24\nssm-2.24\win64> start-process ".\nssm.exe" "install Kibana"
-
Set the following values on the Application tab:
Path: C:\ProgramData\Elastic\kibana-7.0.0-windows-x86_64\bin\kibana.bat
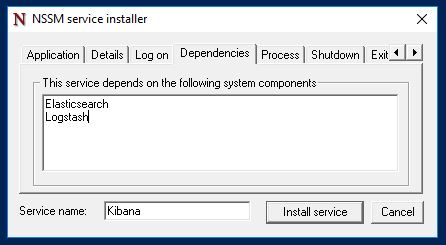
Service name: Kibana - Set a dependency of Elasticsearch and Logstash:
- Click Install service.
-
Navigate to the Kibana configuration file, found in the config directory, which in this case is C:\ProgramData\Elastic\kibana-7.0.0-windows-x86_64\config\kibana.yml.
Open the file in notepad and uncomment/edit the following lines:
# Kibana is served by a back end server. This setting specifies the port to use.
server.port: 5601

# Specifies the address to which the Kibana server will bind. IP addresses and host names are both valid values.
# The default is 'localhost', which usually means remote machines will not be able to connect.
# To allow connections from remote users, set this parameter to a non-loopback address.
server.host: "0.0.0.0"
This will bind Kibana on port 5601 and force it to listen to all IP addresses on the host, this will allow remote hosts to access Kibana via http://IPAddress:5601.
-
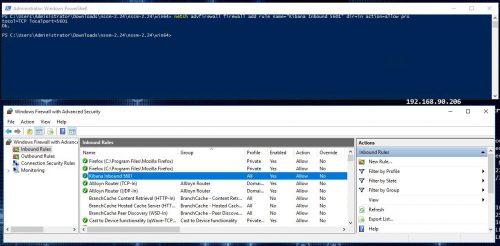
Don’t forget to add a firewall rule to allow the inbound connections:
PS C:\> netsh advfirewall firewall add rule name=Kibana-Inbound-5601 dir=in action=allow protocol=TCP localport=5601
-
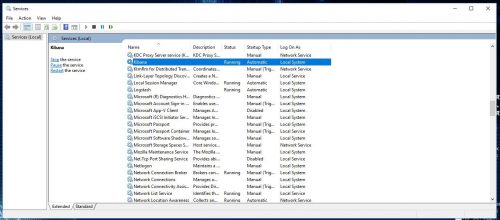
Open services.msc and verify the service starts.
Verify Kibana is accessible by http://IPAddress:5601:
The ELK stack is up and running at this point, now it is time to start ingesting some logs from the local host.
Installing Winlogbeat
Winlogbeat is going to be the “agent” that gets installed on each Windows server/client that will forward logs from the host to the ELK instance. If you have ever worked with Splunk, Winlogbeat is similar in nature to the Universal Forwarder.
-
Download the Winlogbeat package for Windows in .zip format:
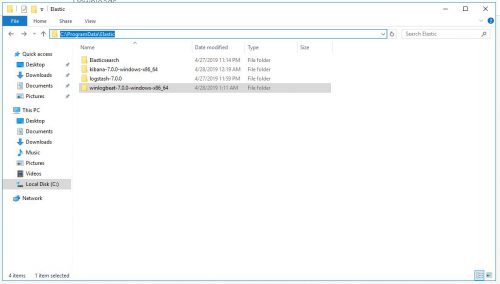
https://www.elastic.co/downloads/beats/winlogbeat - Unzip the package to its permanent home, I will be using C:\ProgramData\Elastic\Winlogbeat:
-
Edit the winlogbeat.yml configuration file, commenting out the Elasticsearch output and uncommenting the Logstash section setting the host to the IP of the ELK server:
#================================ Outputs =====================================

# Configure what output to use when sending the data collected by the beat.

#-------------------------- Elasticsearch output ------------------------------
#output.elasticsearch:
  # Array of hosts to connect to.
  # hosts: ["localhost:9200"]

  # Optional protocol and basic auth credentials.
  #protocol: "https"
  #username: "elastic"
  #password: "changeme"

#----------------------------- Logstash output --------------------------------
output.logstash:
  # The Logstash hosts
  hosts: ["192.168.90.206:5044"]
-
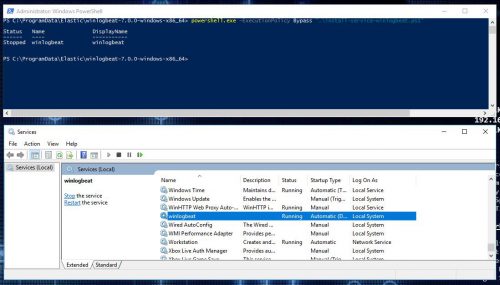
Install Winlogbeat as a service with the PowerShell install script:
PS C:\ProgramData\Elastic\winlogbeat-7.0.0-windows-x86_64> powershell.exe -ExecutionPolicy Bypass ".\install-service-winlogbeat.ps1"
- Make sure the service is started.
Creating An Index Pattern In Kibana
Index patterns tell Kibana what Elasticsearch indices we want to search, so now that there is Winlogbeat data in Elasticsearch, an index pattern needs to be configured on the Kibana side.
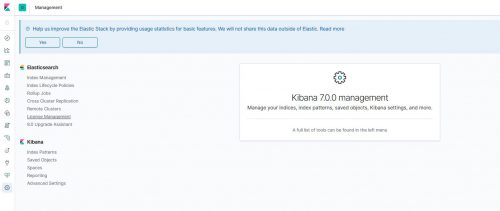
- Access Kibana at http://IPAddress:5601 and click on Explore on my own:
- Click on Management (Gear Icon) on the left hand menu:
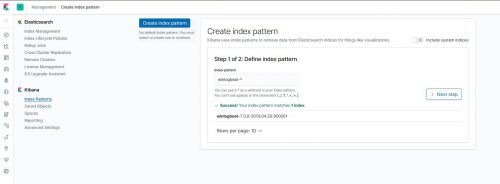
- Click on Kibana > Index Patterns and then Create an Index pattern using winlogbeat-* as the pattern:
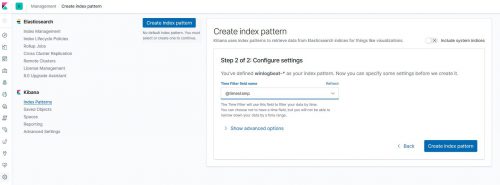
- For the Time Filter field name use @timestamp and then click Create index pattern:
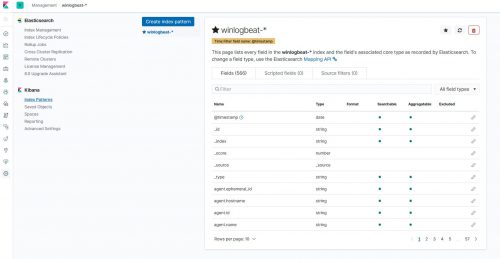
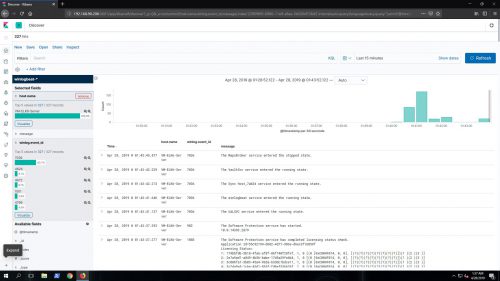
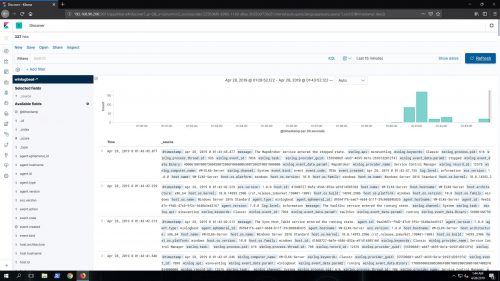
The basic Windows Event Logs – Application, Security, and System are now flowing into the ELK stack from the ELK server itself:
Installing Curator (optional)
One thing that often seems to be an after thought when it comes to the ELK stack is storage/data management, which is critical to monitor/manage since the server will keep ingesting data until it fills the disk. That is where Curator comes in and provides an automated way of accomplishing this task.
Curator is a tool to help curate, or manage, the Elasticsearch indices. In this case, we will be using it as a scheduled task to clear out the older data after it reaches a specified age.
-
Download and install Curator, following the defaults:
https://www.elastic.co/guide/en/elasticsearch/client/curator/current/windows-msi.htmlNote: The default install directory is C:\Program Files\elasticsearch-curator\, we’ll need this for later.
-
To use Curator, two basic configuration files are needed. One is for Curator itself and the other is an “actions” file, that specifies what to delete and the conditions to do so.
You can download a copy of the configuration files I used here:
config.zipThese config files should work for Winlogbeat and Filebeat, clearing data out that is older than 60 days. You can of course tune these configurations to keep as much or little data to suit your needs.
Download and unzip the config folder to C:\Program Files\elasticsearch-curator\.
Note: Make sure the time strings on the Logstash configuration match the Curator “actions_file” configuration, ie timestring: ‘%Y.%W’. In the config files used in this post, I have made sure to match these values already.
-
To test Curator and see what all it would do without making any changes aka a “dry run”, the following command can be used at a cmd prompt:
C:\> "C:\Program Files\elasticsearch-curator\curator.exe" --config "C:\Program Files\elasticsearch-curator\config\curator.yml" --dry-run "C:\Program Files\elasticsearch-curator\config\actions_file.yml"
-
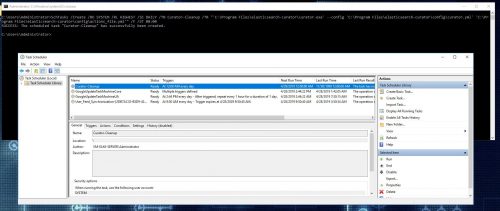
Once you have the right command and have verified it works as expected, Curator can be scheduled as a daily task with the following command:
C:\> SchTasks /Create /RU SYSTEM /RL HIGHEST /SC DAILY /TN Curator-Cleanup /TR "'C:\Program Files\elasticsearch-curator\curator.exe' --config 'C:\Program Files\elasticsearch-curator\config\curator.yml' 'C:\Program Files\elasticsearch-curator\config\actions_file.yml'" /F /ST 00:00
And this is where I am going to end this post, we now have a fully configured ELK 7 Stack running on Windows Server 2016 ingesting the local logs from itself.
In the next post, I will cover:
- Installing and configuring Winlogbeat on Windows 2016 client server
- Installing and configuring Sysmon on Windows 2016 client server
- Configuring Winlogbeat to forward Windows, PowerShell, & Sysmon Events
