Intro
Additional Modules
- Building A Purple Team Lab – Module 1: Lab Overview & Outline
- Building A Purple Team Lab – Module 2: EDR Deployment
- Building A Purple Team Lab – Module 3: Atomic Red Team
Atomic Red Team
Atomic Red Team is an open-source project featuring a library of atomic tests combined with a series of PowerShell modules that are used to simulate adversarial behavior. The project’s documentation is incredibly comprehensive, with each test case mapped to MITRE ATT&CK and accompanied by its own set of detailed documentation. It is highly modular and easy to follow.
This makes Atomic Red Team an ideal project for developing Purple Team test cases while also being a valuable resource to learn from. You’ll get to see working examples of commands and payloads as they are executed on the target system. After that, we’ll take a peek under the hood, gaining visibility into the activity and underlying operating system using EDR/SIEM tooling.
You can find more about Atomic Red Team here:
https://www.atomicredteam.io/
Local/Interactive vs Remote Testing
Before we begin testing, I want to mention an important distinction in how we execute our tests. In the simplest test case, we’ll be using a TTP represented as a single command an attacker would execute on a target system.
- Local/Interactive – The command is executed from an interactive desktop. This could involve the attacker physically sitting at the host or using an interactive remote desktop session (RDP). The attacker would then simply open cmd or PowerShell using the GUI and execute commands. This is the easiest way to test and most likely to succeed without outside interference. While I often start here to observe things in their most basic, successful form, it’s the least likely scenario to reflect how an attacker would execute a command in a real-world scenario.
- Remote – The command is executed through a remote command execution framework, such as PowerShell Remoting, SSH, or Command & Control (C2). Attackers commonly deploy a C2 payload to the host, often in the form of a .exe or .dll file (loaded into another process), to execute commands from that process.
Why does this matter?
Understanding process chaining and rollups is crucial when it comes to reviewing activity using EDR tooling.
When a series of tests are executed in a single interactive session, they commonly show a process chain that gets rolled up into the session/shell process. This results in a process chain like Explorer.exe > PowerShell.exe > 100x cmd.exe processes.
This can be problematic when testing specific payloads and detections, as we need to separate the test cases to verify each outcome.
Remote testing allows us to easily break away from the main shell process chain by initializing the payload using alternate methods. Killing and restarting the process also generates a new PID, which is typically sufficient to isolate the new testing activity from previous executions.
Keep it simple, start with local/interactive testing to ensure success and build confidence, then progress to remote testing.
Installing Atomic Red Team & Invoke-Atomic
In Module 2: EDR Deployment, we setup the Elastic Container Project on an Ubuntu server and then deployed the Elastic Agent on a Windows host.
We will resume from there, running the following commands interactively on the Windows host.
Before we get started with the install of Atomic Red Team, to prevent any interference with the PowerShell scripts, I will usually relax the execution policy:
PS > Get-ExecutionPolicy
PS > Set-ExecutionPolicy Unrestricted
The following command will install a local copy of the Atomic Red Team library along with all of the payloads and the Invoke-Atomic PowerShell modules:
PS > IEX (IWR 'https://raw.githubusercontent.com/redcanaryco/invoke-atomicredteam/master/install-atomicredteam.ps1' -UseBasicParsing);
Install-AtomicRedTeam -getAtomics -InstallPath "C:\AtomicRedTeam" -Force
There are a few important notes regarding this command:
- Default Location – C:\AtomicRedTeam is the default, if you specify different path, you will need to append -PathToAtomics “C:\Path\” to each Invoke-Atomic command.
- Session Only – The Invoke-Atomic modules will only be available for the current session.
- Attack Library Download – This is going to download a library of attacks to the local disk, it is expected that files will be flagged but they shouldn’t be blocked with the current Elastic Security configuration.
To install the PowerShell modules permanently:
PS > Install-Module -Name invoke-atomicredteam,powershell-yaml -Scope CurrentUser
Verify the installation:
PS > Get-ChildItem C:\AtomicRedTeam\

Directory: C:\AtomicRedTeam

Mode                 LastWriteTime         Length Name
----                 -------------         ------ ----
d-----          3/9/2026   6:08 PM                atomics
d-----          3/9/2026   6:07 PM                invoke-atomicredteam

PS > Get-Command Invoke-Atomic*

CommandType     Name                                               Version    Source
-----------     ----                                               -------    ------
Function        Invoke-AtomicRunner                                2.1.0      Invoke-AtomicRedTeam
Function        Invoke-AtomicTest                                  2.1.0      Invoke-AtomicRedTeam
Identify – List & Review The Available Atomic Tests
Get help:
PS > get-help Invoke-AtomicTest

NAME
    Invoke-AtomicTest

SYNTAX
    Invoke-AtomicTest [-AtomicTechnique] <string[]> [-ShowDetails] [-ShowDetailsBrief] [-anyOS] [-TestNumbers
    <string[]>] [-TestNames <string[]>] [-TestGuids <string[]>] [-PathToAtomicsFolder <string>] [-CheckPrereqs]
    [-PromptForInputArgs] [-GetPrereqs] [-Cleanup] [-NoExecutionLog] [-ExecutionLogPath <string>] [-Force]
    [-InputArgs <hashtable>] [-TimeoutSeconds <int>] [-Session <PSSession[]>] [-Interactive]
    [-KeepStdOutStdErrFiles] [-LoggingModule <string>] [-SupressPathToAtomicsFolder] [-WhatIf] [-Confirm]
    [<CommonParameters>]
View all available atomic tests that apply to the current platform:
PS > Invoke-AtomicTest All -ShowDetailsBrief

PathToAtomicsFolder = C:\AtomicRedTeam\atomics
                                                                                                                                                                                        T1001.002-1 Steganographic Tarball Embedding
T1001.002-2 Embedded Script in Image Execution via Extract-Invoke-PSImage
T1003-1 Gsecdump
T1003-2 Credential Dumping with NPPSpy
T1003-3 Dump svchost.exe to gather RDP credentials
T1003-4 Retrieve Microsoft IIS Service Account Credentials Using AppCmd (using list)
T1003-5 Retrieve Microsoft IIS Service Account Credentials Using AppCmd (using config)
T1003-6 Dump Credential Manager using keymgr.dll and rundll32.exe
T1003-7 Send NTLM Hash with RPC Test Connection
T1003.001-1 Dump LSASS.exe Memory using ProcDump
T1003.001-2 Dump LSASS.exe Memory using comsvcs.dll
T1003.001-3 Dump LSASS.exe Memory using direct system calls and API unhooking
T1003.001-4 Dump LSASS.exe Memory using NanoDump
T1003.001-6 Offline Credential Theft With Mimikatz
T1003.001-7 LSASS read with pypykatz
T1003.001-8 Dump LSASS.exe Memory using Out-Minidump.ps1
T1003.001-9 Create Mini Dump of LSASS.exe using ProcDump
...snip...
That’s a huge list, so I usually write the test list out to text file:
PS > Invoke-AtomicTest All -ShowDetailsBrief *>&1 | Tee-Object ART-Tests.txt; notepad ART-Tests.txt
Let’s go with T1003.001-2 Dump LSASS.exe Memory using comsvcs.dll as our test case.
View detailed information about a specific test:
PS > Invoke-AtomicTest T1003.001-2 -ShowDetails

PathToAtomicsFolder = C:\AtomicRedTeam\atomics

[********BEGIN TEST*******]
Technique: OS Credential Dumping: LSASS Memory T1003.001
Atomic Test Name: Dump LSASS.exe Memory using comsvcs.dll
Atomic Test Number: 2
Atomic Test GUID: 2536dee2-12fb-459a-8c37-971844fa73be
Description: The memory of lsass.exe is often dumped for offline credential theft attacks. This can be achieved with a built-in dll.
Upon successful execution, you should see the following file created $env:TEMP\lsass-comsvcs.dmp.

Attack Commands:
Executor: powershell
ElevationRequired: True
Command:
C:\Windows\System32\rundll32.exe C:\windows\System32\comsvcs.dll, MiniDump (Get-Process lsass).id $env:TEMP\lsass-comsvcs.dmp full

Cleanup Commands:
Command:
Remove-Item $env:TEMP\lsass-comsvcs.dmp -ErrorAction Ignore
[!!!!!!!!END TEST!!!!!!!]
The output shows us that the command the attacker would execute on the endpoint should look something like this:
Command:
C:\Windows\System32\rundll32.exe C:\windows\System32\comsvcs.dll, MiniDump (Get-Process lsass).id $env:TEMP\lsass-comsvcs.dmp full
This command will become one of the primary indicators that we look for later on in the EDR tooling.
Check the prerequisites prior to running a test:
PS > Invoke-AtomicTest T1003.001-2 -CheckPrereqs
Attempt to resolve any required prerequisites:
PS > Invoke-AtomicTest T1003.001-2 -GetPrereqs
Test – Execute Atomic Tests Using Invoke-Atomic
Single Test
Execute the test with automatic cleanup:
PS > Invoke-AtomicTest T1003.001-2 -Cleanup

PathToAtomicsFolder = C:\AtomicRedTeam\atomics

Executing cleanup for test: T1003.001-2 Dump LSASS.exe Memory using comsvcs.dll
Done executing cleanup for test: T1003.001-2 Dump LSASS.exe Memory using comsvcs.dll
Logs are automatically captured to the default temp directory during the execution phase.
To find the configured location:
PS > $env:temp
Log output:
"Execution Time (UTC)","Execution Time (Local)","Technique","Test Number","Test Name","Hostname","IP Address","Username","GUID","ProcessId","ExitCode"
"2026-03-09T23:29:13Z","2026-03-09T18:29:13Z","T1003.001","2","Dump LSASS.exe Memory using comsvcs.dll","VMW-L-WS","192.168.90.91","vmw-l-ws\administrator","2536dee2-12fb-459a-8c37-971844fa73be","380","0"
All Tests
It’s not recommended, but it is possible to execute all of the tests:
PS > Invoke-AtomicTest All -Cleanup -TimeoutSeconds 15 -Confirm:$false
This is the more nuclear option, if left unchecked it will likely crash the system, but it’s still an interesting experiment. #yolosec!
Results (network crashed, vm stayed up but mostly unresponsive):
There’s a better approach documented on the wiki, using a simple PowerShell loop to break up the process:
https://www.atomicredteam.io/invoke-atomicredteam/docs/execute-tests-locally
Remote Testing Support
Remote testing is supported using PowerShell Remoting to establish the initial connection, and then executing the invoke-atomic commands with the -Session parameter:
https://www.atomicredteam.io/invoke-atomicredteam/docs/execute-tests-remotely
Note that if your using Linux/macOS to Windows, you’ll need to configure PowerShell Remoting over SSH.
Review – Alerts & Telemetry With Elastic Security
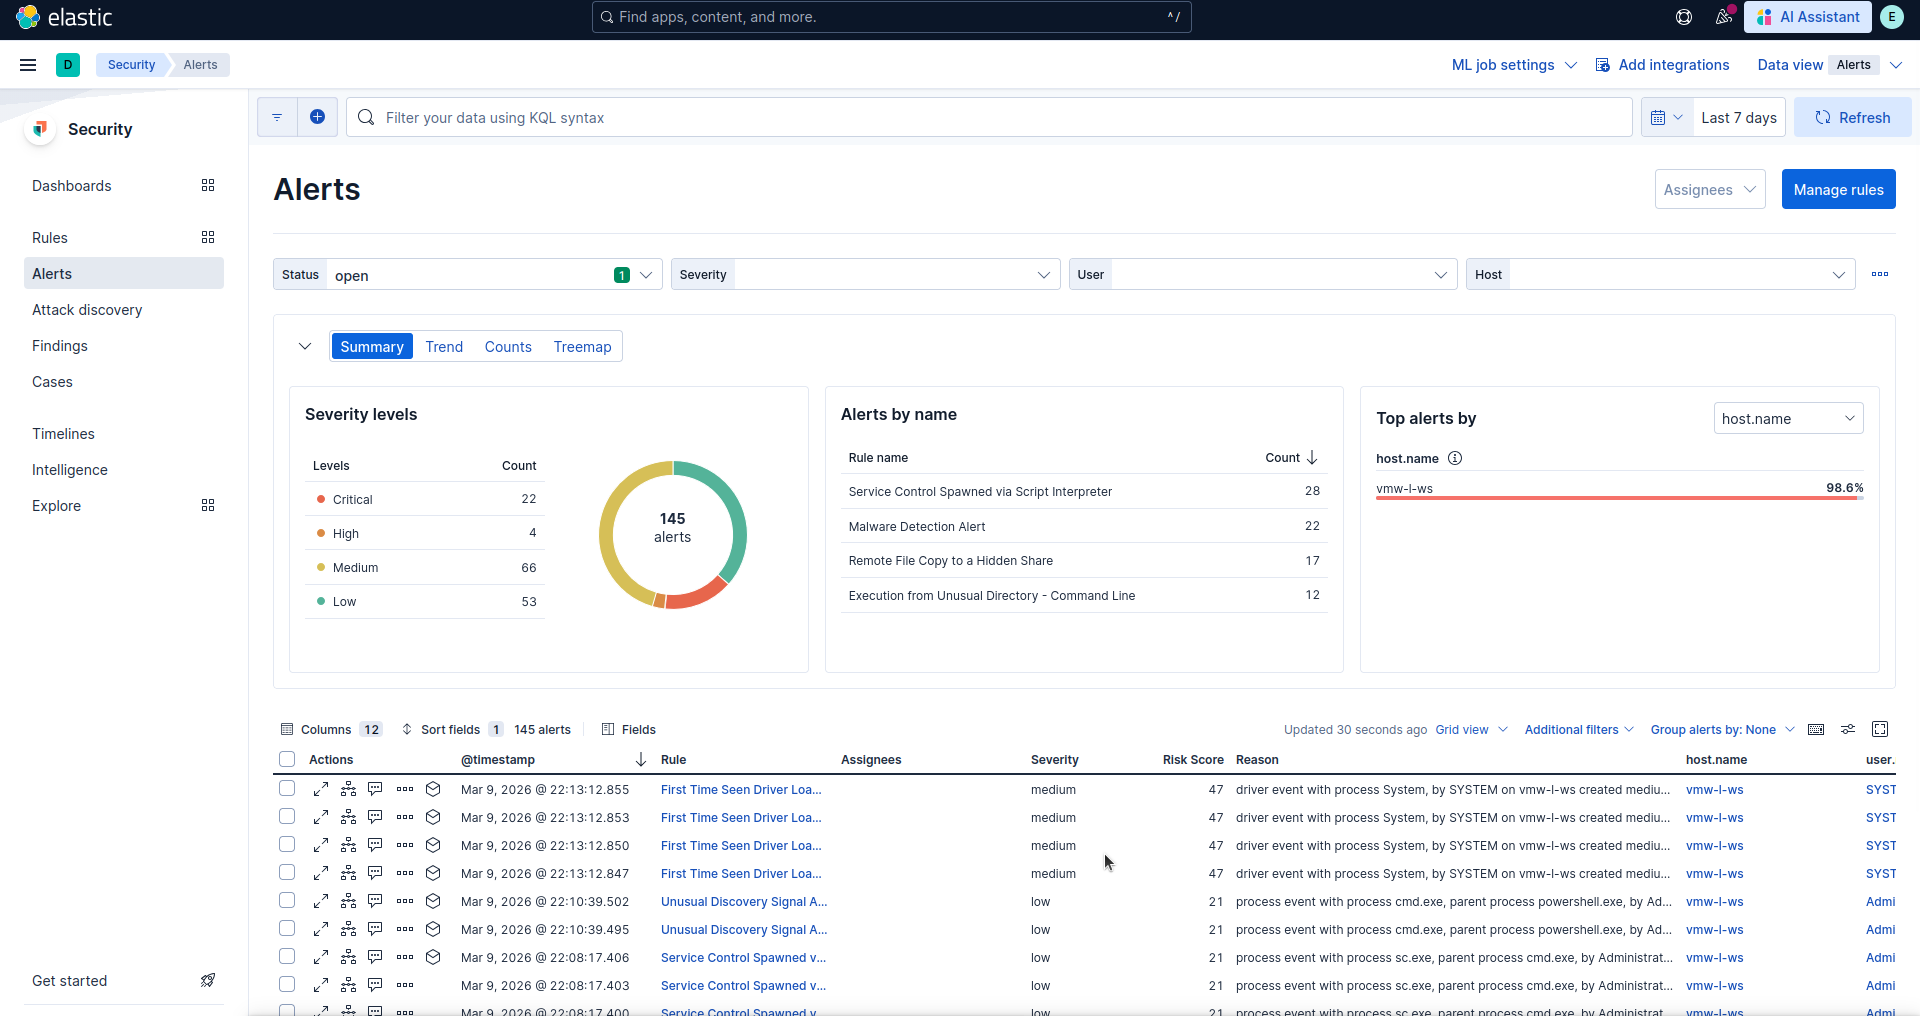
Alerts
Moving back over the Elastic Security instance from the previous module, navigate to Elastic > Security > Alerts:
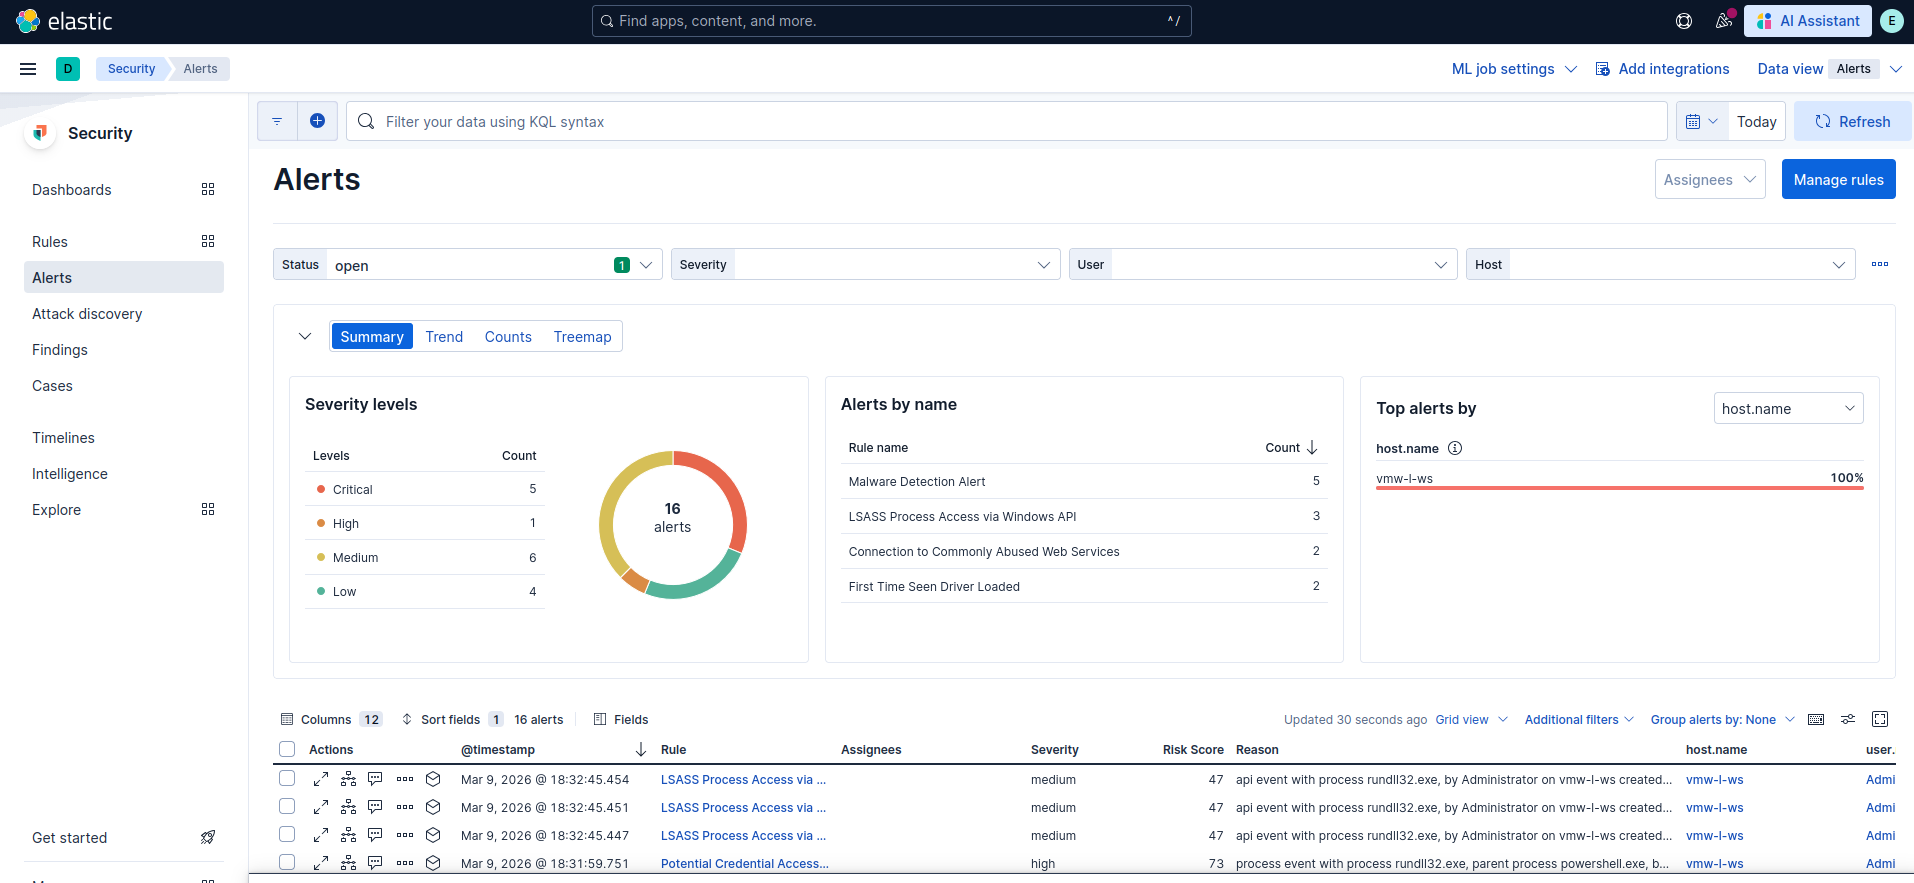
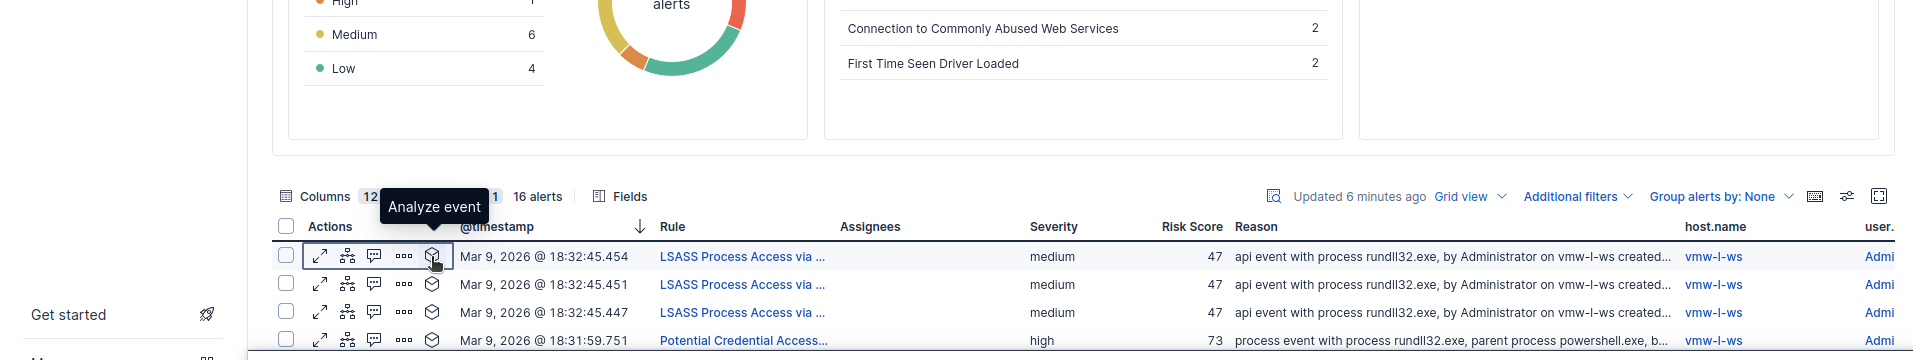
Find the alert related to the Atomic testing, and select Analyze under Actions in the bottom pane:
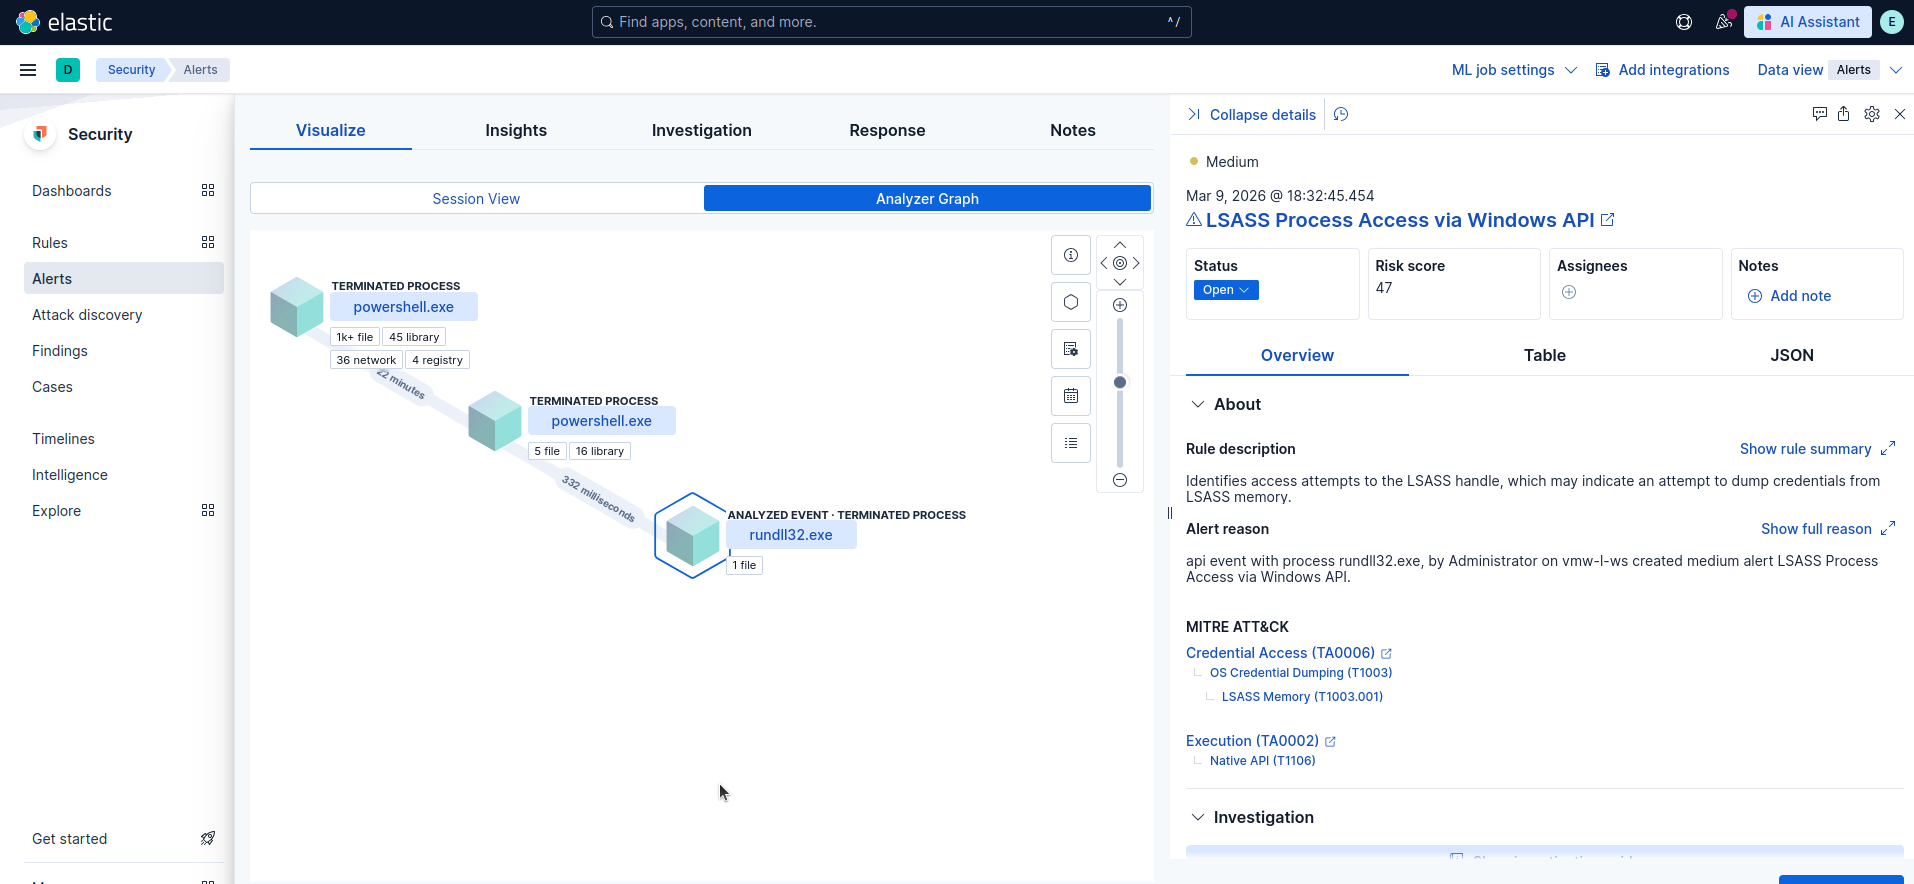
Explore the Overview and Table views on the right:
Reviewing alerts like this will help you learn which key values (e.g., CommandLine, User, ParentProcess) are most valuable, making manual data searches easier. Although key names may vary between EDR vendors, they are generally similar, and the underlying values remain consistent because they are OS-specific. As a result, any knowledge gained here will be directly applicable to other EDR solutions you may use.
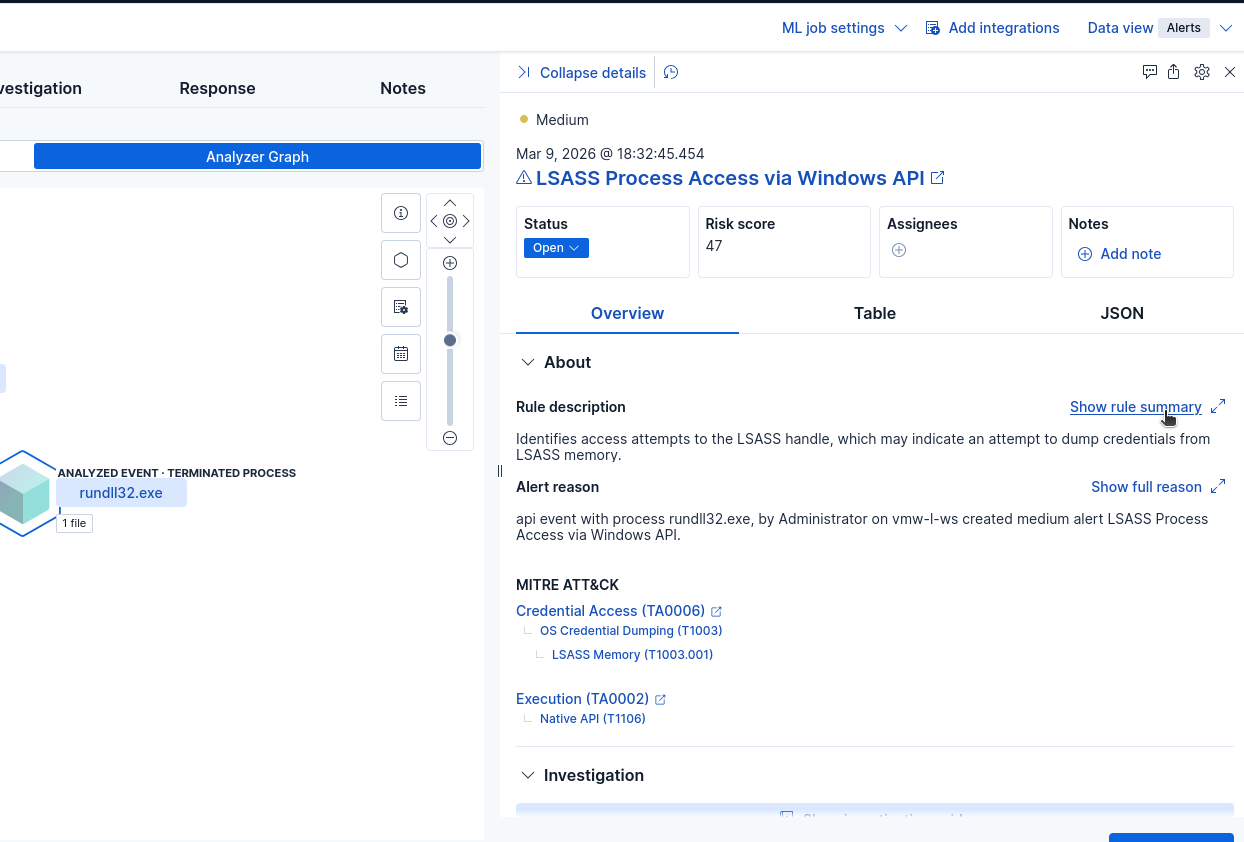
Try clicking through the Analyzer Graph while reviewing the data on the right:

Notice that the entire process chain was recorded here, we can see PowerShell being used to launch the Atomic Modules, as well as portions of our command line indicator from before:
C:\Windows\System32\rundll32.exe C:\windows\System32\comsvcs.dll, MiniDump (Get-Process lsass).id $env:TEMP\lsass-comsvcs.dmp full
Back in the Analyze Event Overview, click Show rule summary:
Then Show full rule details:
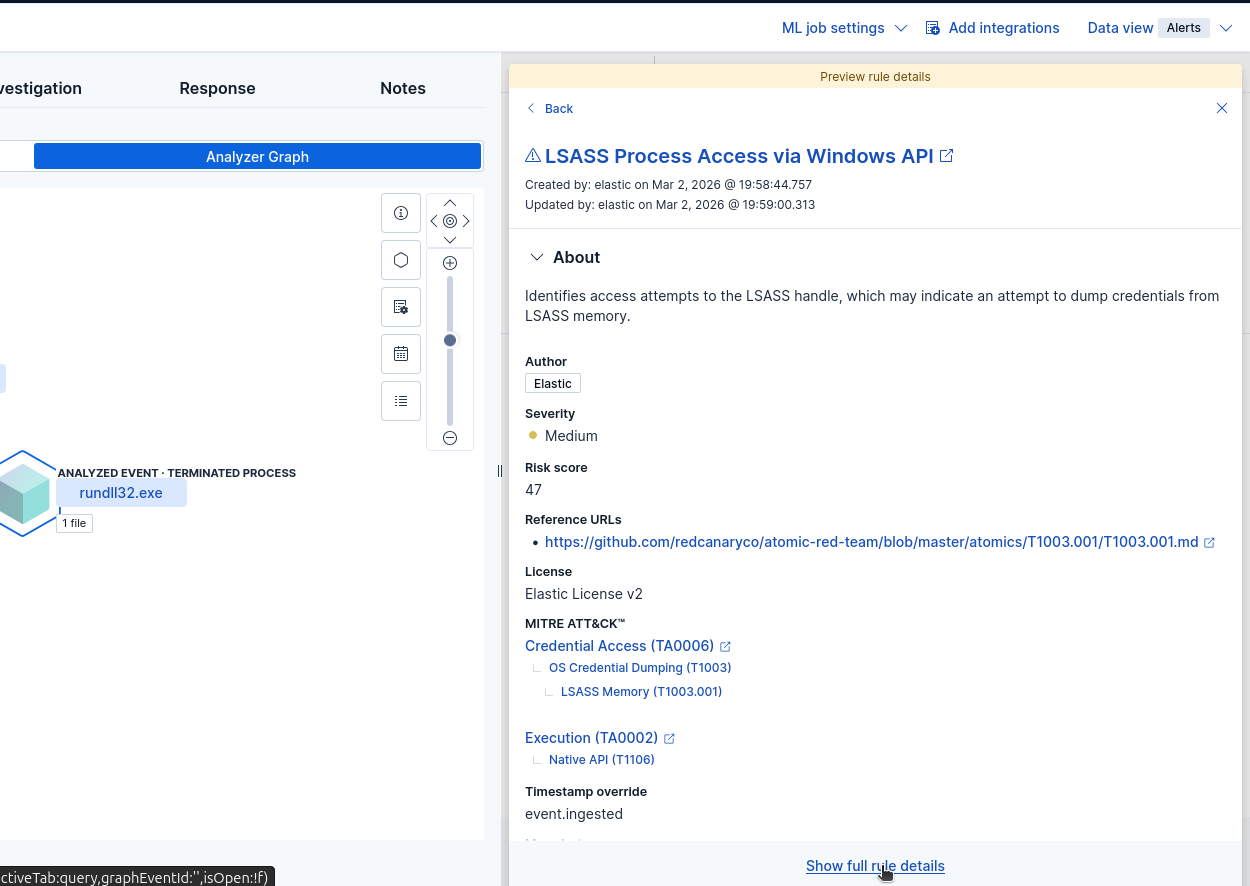
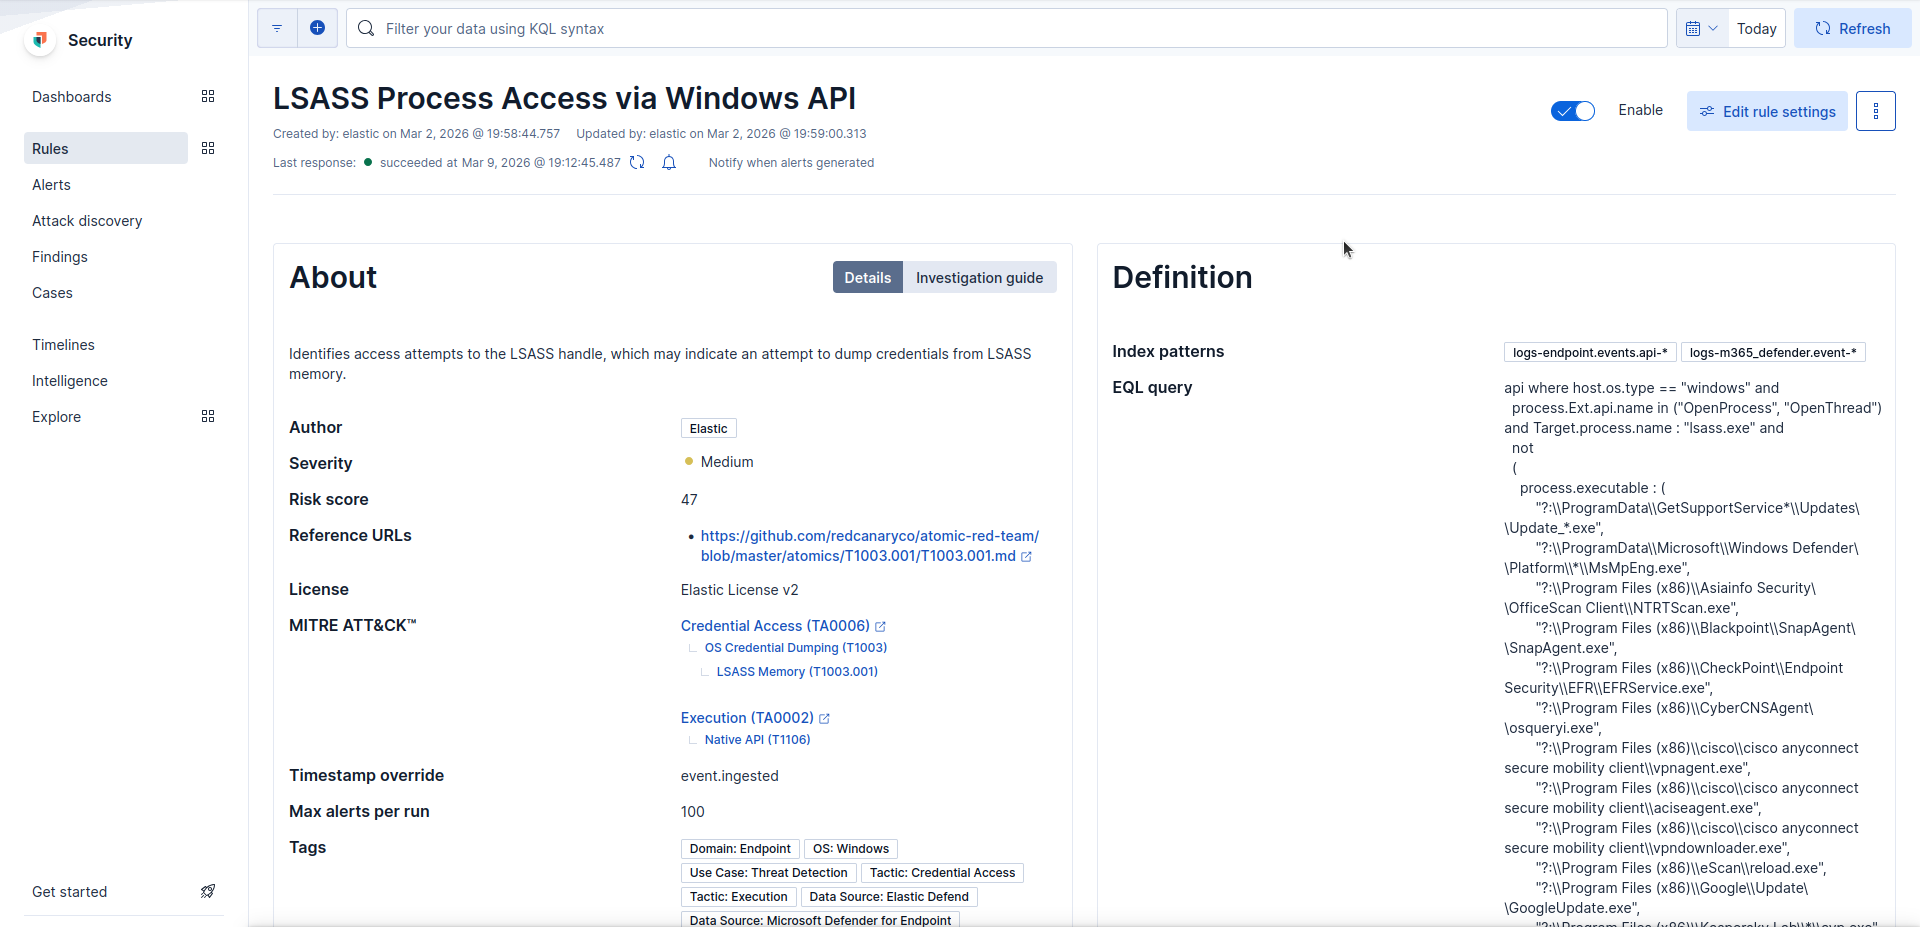
Here you’ll find a wealth of information including the sources used and detection logic:
Discover
Let’s try taking a simple but unique portion of that detection rule that should apply to our Atomic testing and then searching for it under Analytics > Discover:
"lsass"

This is where things to get really interesting! Alerts often provide a snapshot in time, reflecting the EDR’s assessment of related activity. It’s crucial to move beyond the alert and conduct a manual review of surrounding telemetry to identify potential connections. A great deal of additional context can be hidden within this telemetry, and it’s simply a matter of knowing how to search.
With just a simple string search we were able to find a bunch of raw data related to our testing, some of it is alerts, process/file info and so on. Each event will have its own set of related data on it to sift through. And since we found this using search, we can now also start to narrow things down and eliminating false positives by adding fields and values we want to include or exclude.
Notice in these event’s we call also see our full command line indicator, but we see it twice, once as it was initially executed by PowerShell and then as a child process that is fully resolved including the PID of lsass and temp path:
![]()
Unfortunately, this is where vendor-agnostic advantages begin to diminish. Most EDR platforms rely on a SIEM for their backend, and their search and formatting tools are generally proprietary, employing their own unique syntax. Given the complexity of this area, we will not explore it in detail here. However, as you become more reliant on a specific vendor, the time invested in mastering their query language can be incredibly valuable in managing the massive data sets associated with large, dynamic environments. The ability to perform basic counts and statistical analysis becomes especially useful when searching across hundreds of thousands of endpoints.
Building Additional Test Cases
This is a fairly simple but repeatable process, think of it like this:
- Identify – List, select, check/get prereqs:
-
PS > Invoke-AtomicTest All -ShowDetailsBrief
PS > Invoke-AtomicTest T1003.001-2 -ShowDetails
PS > Invoke-AtomicTest T1003.001-2 -CheckPrereqs
PS > Invoke-AtomicTest T1003.001-2 -GetPrereqs
- Test – Execute
-
PS > Invoke-AtomicTest T1003.001-2 -Cleanup
- Review – Alerts & Telemetry
- Alerts
- Discover
- Identify additional key fields/values
Moving Beyond Atomic Red Team
As we have already seen moving through this module, while we were using Atomic Red Team to supply our test cases, a command is a command, regardless of where it comes from. If you see something interesting in an intelligence report or a forensic case you are working, trying testing it out yourself to see if you can gain some further insight.
That’s the beauty of this lab setup, see something interesting? Flush it down the Elastic pipe and see what comes out the other side!
Obviously, you will want to exercise caution when running untrusted code/binaries!
Next Steps…
In the next post, I will cover the following:
- Command & Control (C2) Setup
- Identify – Shellcode/Payload Generation
- Test – Shellcode/Payload Execution
- Review – Alerts & Telemetry With Elastic Security