Overview
This will be a multi-part series focused on setting up a Purple Team lab with the following high-level goals in mind:
- Locally hosted using open-source software where possible (Free)
- Deploy & configure an Endpoint Detection & Response (EDR) solution
- Gain hands on experience testing basic red team tactics, techniques, and procedures (TTPs) on Windows endpoints
- Learn how to review alerts and available telemetry using EDR & Security Information and Event Management (SIEM) tooling
- Create reusable test case scenarios
- Keep it simple, if it’s not, you won’t use it
I plan on breaking this series down into four modules:
- Lab Overview & Outline
- EDR Deployment: The Elastic Container Project
- Test Scenario 1: Atomic Red Team
- Test Scenario 2: Command & Control (C2)
Who Is This For?
- Defensive Engineers/Blue Teamers – Build a framework to safely test TTPs and gain experience with telemetry and tooling that resembles what you’d see in real world SOC, Threat Hunting, Incident Response roles.
- Offensive Engineers/Red Teamers – Gain insight into available telemetry and sources, useful for evasion but also making better remediation recommendations on findings.
- Detection Engineers – Stay ahead of the curve testing and developing content for new vulnerabilities before they come up at work.
The tools and test scenarios I will cover are meant to be beginner friendly, but the basic formula scales very well with experience.
Lab Setup
The lab environment I will be using for this post consists of 3 virtual machines that are all on the same local network:
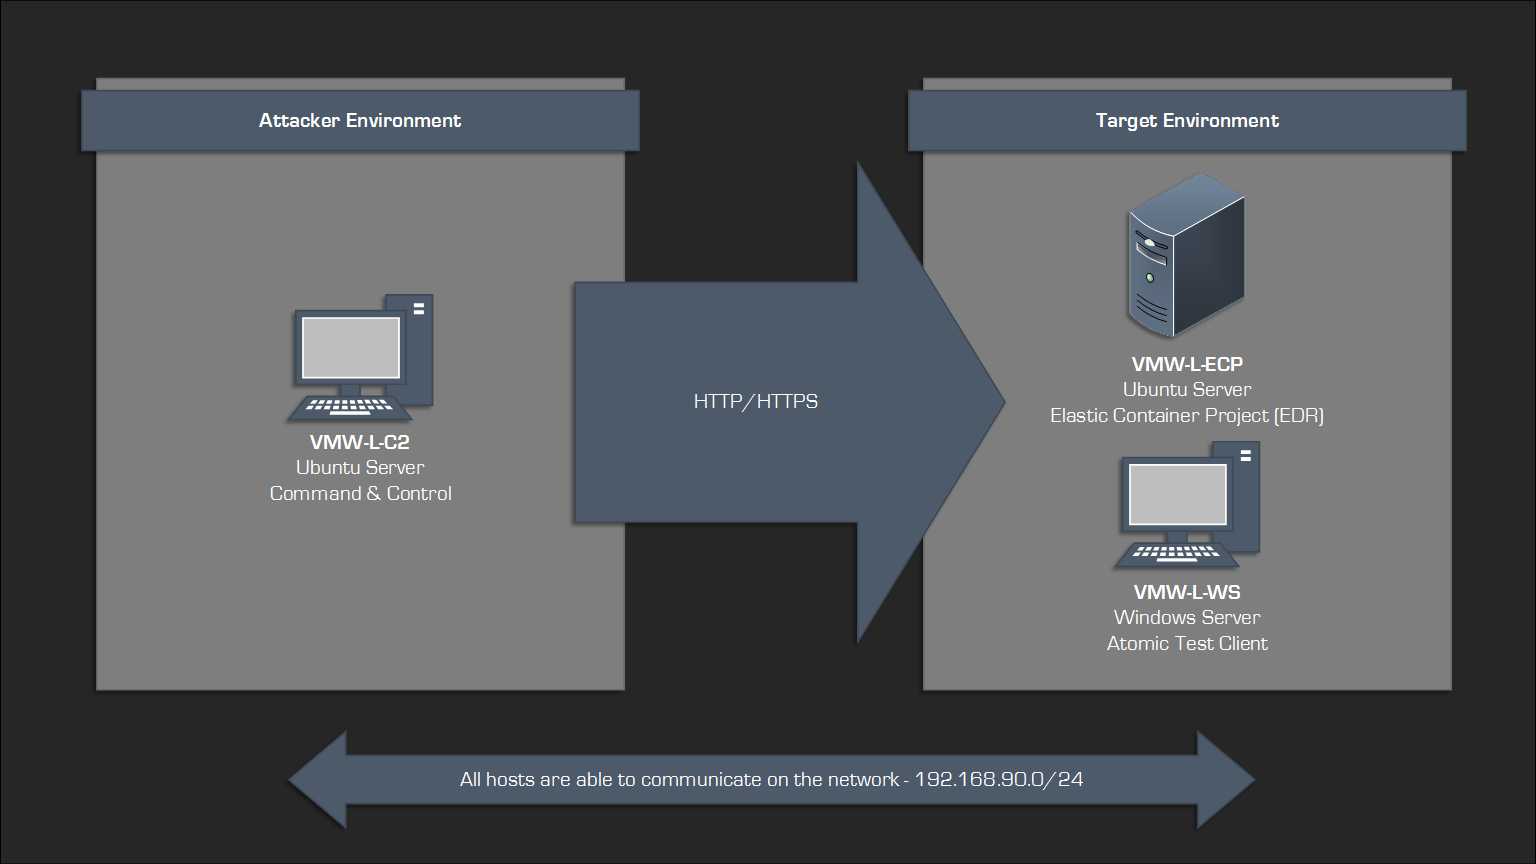
| Hostname | Address | OS | Notes |
| VMW-L-ECP | 192.168.90.90 | Ubuntu Server | Elastic Container Project |
| VMW-L-WS | 192.168.90.91 | Windows Server | Atomic Test Client |
| VMW-L-C2 |
192.168.90.80 c2.robwillis.info |
Ubuntu Server | Command & Control |
The hosts have all been base prepped, including OS installation, user creation, network configuration, and remote access (RDP/SSH).
I will be using a Windows host as the target/test client, as it represents the most prevalent endpoint type. However, Linux and macOS are also supported.
The “I” In Purple Team
Purple Teaming seems to have an ever-expanding meaning, but for the sake of this post, I will define Purple Teaming as collaborative “open-book” testing between offensive/red and defensive/blue teams, with the goal of evaluating activity to identify and remediate potential security gaps.
That’s a bit of a mouthful, but it’s simpler when you think of it like this:
By understanding and executing both the red and blue sides of a given scenario, you gain a much deeper understanding, allowing you to easily convey those concepts to a wider audience, which usually results in more successful outcomes.
Atomic Testing vs Exercises
Exercises are a common component of Purple Teaming, but they can significantly increase complexity. Managing exercises requires careful consideration of infrastructure, expertise, planning, and execution. If any of these areas are inadequate, the exercise will be scaled back, transforming what was initially an ambitious plan into a predictable sequence of common TTPs. The end result can be a significant time investment for an exercise that can feel like burdensome work with limited practical value.
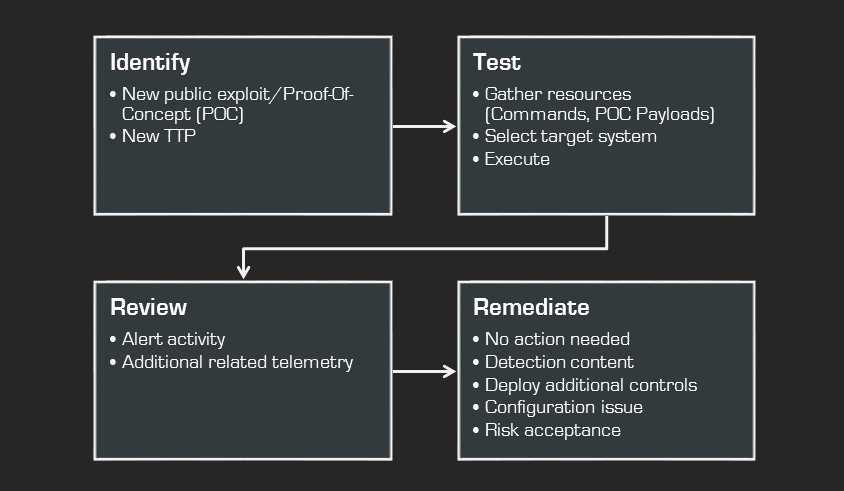
Therefore, for this series, I will focus on atomic-style test methods and frameworks to provide as much exposure as possible. This way, when the time comes, you’ll have the expertise needed to build your own exercises.
MITRE ATT&CK
MITRE ATT&CK is a globally recognized framework detailing adversary TTPs. It’s a fantastic resource for Purple Teaming, providing a structured and prioritized list of attacker behaviors to simulate, which is ideal for creating test cases and validating overall defensive coverage.
You can find more information about MITRE ATT&CK here:
MITRE ATT&CK
As the target host in the lab will be Windows, it’s worth taking a look at the matrix found here:
MITRE ATT&CK – Enterprise – Windows
Long-Term Tracking
With so many moving parts, it’s important to have a way to document and track everything.
At a minimum, we want to keep thorough documentation of the test cases (hosts, commands, payloads) and results (alerts, queries, IOCs/IOAs) to ensure we can replicate testing and validate any remediation efforts.
Given that this is largely a manual process, even when using commercial tools, the biggest hurdle is capturing all the data accurately. Whatever the process, if it’s a hassle to input or retrieve it, people won’t use it.
For the sake of this lab, a simple solution like Notepad, OneNote, or Trilium Notes and a well-organized structure will be sufficient.
If you’re looking for something a bit more serious, Vectr is probably the most commonly used tool for this, and there’s a free community version available. You can find more information here:
Vectr.io
Modern Security Stacks & Telemetry
Most modern organizations have a basic security stack that looks something like the following:
- Endpoint Detection & Response (EDR) – Collected via Endpoint Agent
- Processes/Threads
- File System
- Registry
- Network
- Memory
- Central Logging/Security Information & Event Management (SIEM) – Collected via Endpoint/Syslog Forwarders
- EDR Alerts/Data
- Anti-Virus (AV)
- Operating System (OS)
- Web Proxy
- Firewall
- WAF/IDS/IPS
- DNS
- Application
- Sandbox Analysis
- Packet Capture
There is a ton of value in being familiar with all of these data sources, and eventually, you should aim to master them all. However, it’s crucial to be practical here and recognize that there are significant variations in their availability, scalability, and overall value.
For instance, many organizations only centrally collect server logs, not workstation logs, due to the substantial resource requirements for network bandwidth, storage, and compute power. This often prevents the implementation of additional logging policies that are not enabled by default, such as Event ID 4688 (New Process Created).
The same goes for tooling, it’s easy to get swept up in popular trends, fueled by vendors or social media, and then invest a significant amount of time and energy (ex. “100 Days of…”) mastering the thing, only to experience frustration later on when those technologies aren’t available in a particular environment.
A prime example of this is Yara. While it’s an incredibly valuable project and format to understand, many engineers don’t realize that executing custom Yara rules across an entire environment is often not possible until they attempt to do it. Now the rule requires conversion to a compatible system, such as a SIEM, which turns into more frustration if you didn’t spend time learning that and then realize the same data isn’t even available! This is a concerning cycle I’ve seen repeat many times. Be aware of these potential pitfalls, and try to prioritize your time strategically.
To maximize our time and ensure the greatest impact, I am going to focus on EDR as the main data source for this project as it provides the highest value and offers the most comprehensive view of any single data source. As a blue teamer, this is probably the most common data source that you will have access to, and from a red team perspective, it is often the most difficult control to bypass.
Because EDR solutions all collect similar telemetry, the knowledge gained from one is typically just as valuable when exploring other vendors, for example, transitioning from Elastic to CrowdStrike. Furthermore, since EDR data is often stored within a SIEM, the querying skills developed will typically be applicable as you begin exploring other sources.
Next Steps…
In the next post, I will cover the following:
- Installing & Managing The Elastic Container Project On Ubuntu
- Installing The Elastic Agent On Windows
- Verifying The Elastic Deployment & Configuration